Machine Learning
Learning is Looping
An ML model is Trained by Looping over data multiple times.
For each iteration, the Weight Values are adjusted.
Training is complete when the iterations fails to Reduce the Cost.
Train me to find the line of best fit:
Gradient Descent
Gradient Descent is a popular algorithm for solving AI problems.
A simple Linear Regression Model can be used to demonstrate a gradient descent.
The goal of a linear regression is to fit a linear graph to a set of (x,y) points. This can be solved with a math formula. But a Machine Learning Algorithm can also solve this.
This is what the example above does.
It starts with a scatter plot and a linear model (y = wx + b).
Then it trains the model to find a line that fits the plot. This is done by altering the weight (slope) and the bias (intercept) of the line.
Below is the code for a Trainer Object that can solve this problem (and many other problems).
A Trainer Object
Create a Trainer object that can take any number of (x,y) values in two arrays (xArr,yArr).
Set weight to zero and the bias to 1.
A learning constant (learnc) has to be set, and a cost variable must be defined:
Example
function Trainer(xArray, yArray) {
this.xArr = xArray;
this.yArr = yArray;
this.points = this.xArr.length;
this.learnc = 0.00001;
this.weight = 0;
this.bias = 1;
this.cost;
Cost Function
A standard way to solve a regression problem is with an "Cost Function" that measures how good the solution is.
The function uses the weight and bias from the model (y = wx + b) and returns an error, based on how well the line fits a plot.
The way to compute this error is to loop through all (x,y) points in the plot, and sum the square distances between the y value of each point and the line.
The most conventional way is to square the distances (to ensure positive values) and to make the error function differentiable.
this.costError = function() {
total = 0;
for (let i = 0; i < this.points; i++) {
total += (this.yArr[i] - (this.weight * this.xArr[i] + this.bias)) **2;
}
return total / this.points;
}
Another name for the Cost Function is Error Function.
The formula used in the function is actually this:
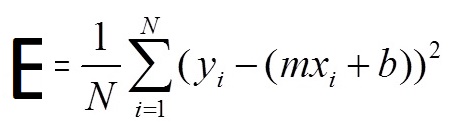
- E is the error (cost)
- N is the total number of observations (points)
- y is the value (label) of each observation
- x is the value (feature) of each observation
- m is the slope (weight)
- b is intercept (bias)
- mx + b is the prediction
- 1/N * N∑1 is the squared mean value
The Train Function
We will now run a gradient descent.
The gradient descent algorithm should walk the cost function towards the best line.
Each iteration should update both m and b towards a line with a lower cost (error).
To do that, we add a train function that loops over all the data many times:
this.train = function(iter) {
for (let i = 0; i < iter; i++) {
this.updateWeights();
}
this.cost = this.costError();
}
An Update Weights Function
The train function above should update the weights and biases in each iteration.
The direction to move is calculated using two partial derivatives:
this.updateWeights = function() {
let wx;
let w_deriv = 0;
let b_deriv = 0;
for (let i = 0; i < this.points; i++) {
wx = this.yArr[i] - (this.weight * this.xArr[i] + this.bias);
w_deriv += -2 * wx * this.xArr[i];
b_deriv += -2 * wx;
}
this.weight -= (w_deriv / this.points) * this.learnc;
this.bias -= (b_deriv / this.points) * this.learnc;
}
Create Your Own Library
Library Code
function Trainer(xArray, yArray) {
this.xArr = xArray;
this.yArr = yArray;
this.points = this.xArr.length;
this.learnc = 0.00001;
this.weight = 0;
this.bias = 1;
this.cost;
// Cost Function
this.costError = function() {
total = 0;
for (let i = 0; i < this.points; i++) {
total += (this.yArr[i] - (this.weight * this.xArr[i] + this.bias)) **2;
}
return total / this.points;
}
// Train Function
this.train = function(iter) {
for (let i = 0; i < iter; i++) {
this.updateWeights();
}
this.cost = this.costError();
}
// Update Weights Function
this.updateWeights = function() {
let wx;
let w_deriv = 0;
let b_deriv = 0;
for (let i = 0; i < this.points; i++) {
wx = this.yArr[i] - (this.weight * this.xArr[i] + this.bias);
w_deriv += -2 * wx * this.xArr[i];
b_deriv += -2 * wx;
}
this.weight -= (w_deriv / this.points) * this.learnc;
this.bias -= (b_deriv / this.points) * this.learnc;
}
} // End Trainer Object
Now you can include the library in HTML:
<script src="myailib.js"></script>

