Data Science - Statistics Correlation
Correlation
Correlation measures the relationship between two variables.
We mentioned that a function has a purpose to predict a value, by converting input (x) to output (f(x)). We can say also say that a function uses the relationship between two variables for prediction.
Correlation Coefficient
The correlation coefficient measures the relationship between two variables.
The correlation coefficient can never be less than -1 or higher than 1.
- 1 = there is a perfect linear relationship between the variables (like Average_Pulse against Calorie_Burnage)
- 0 = there is no linear relationship between the variables
- -1 = there is a perfect negative linear relationship between the variables (e.g. Less hours worked, leads to higher calorie burnage during a training session)
Example of a Perfect Linear Relationship (Correlation Coefficient = 1)
We will use scatterplot to visualize the relationship between Average_Pulse and Calorie_Burnage (we have used the small data set of the sports watch with 10 observations).
This time we want scatter plots, so we change kind to "scatter":
Example
import matplotlib.pyplot as plt
health_data.plot(x ='Average_Pulse', y='Calorie_Burnage',
kind='scatter')
plt.show()
Try it Yourself »
Output:
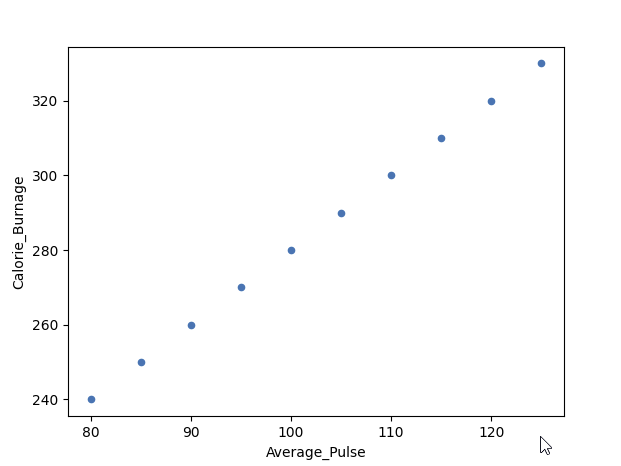
As we saw earlier, it exists a perfect linear relationship between Average_Pulse and Calorie_Burnage.
Example of a Perfect Negative Linear Relationship (Correlation Coefficient = -1)
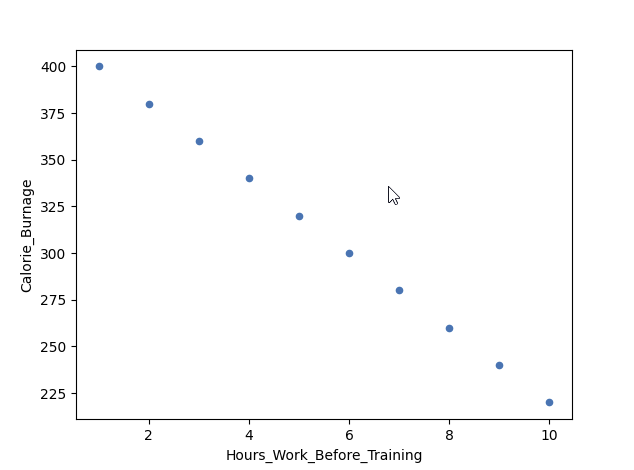
We have plotted fictional data here. The x-axis represents the amount of hours worked at our job before a training session. The y-axis is Calorie_Burnage.
If we work longer hours, we tend to have lower calorie burnage because we are exhausted before the training session.
The correlation coefficient here is -1.
Example
import pandas as pd
import matplotlib.pyplot as plt
negative_corr =
{'Hours_Work_Before_Training': [10,9,8,7,6,5,4,3,2,1],
'Calorie_Burnage':
[220,240,260,280,300,320,340,360,380,400]}
negative_corr = pd.DataFrame(data=negative_corr)
negative_corr.plot(x ='Hours_Work_Before_Training',
y='Calorie_Burnage', kind='scatter')
plt.show()
Try it Yourself »
Example of No Linear Relationship (Correlation coefficient = 0)
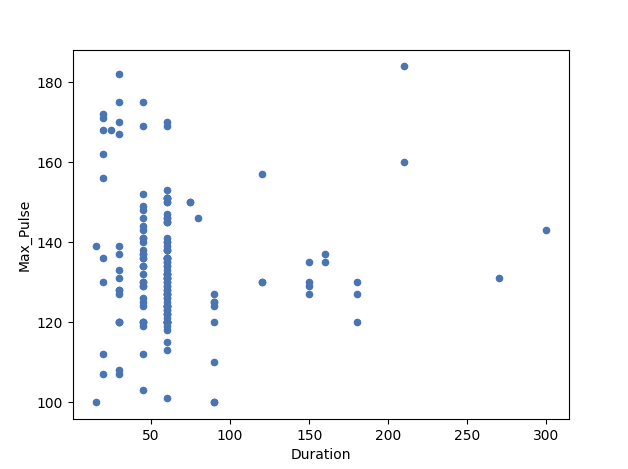
Here, we have plotted Max_Pulse against Duration from the full_health_data set.
As you can see, there is no linear relationship between the two variables. It means that longer training session does not lead to higher Max_Pulse.
The correlation coefficient here is 0.
Example
import matplotlib.pyplot as plt
full_health_data.plot(x ='Duration', y='Max_Pulse',
kind='scatter')
plt.show()
Try it Yourself »

