Google Sheets STDEV.P Function
STDEV.P Function
The STDEV.P function is a premade function in Google Sheets, which calculates the Standard Deviation (Stdev) for the entire population.
It is typed =STDEV.P and gets a list of cells:
=STDEV.P(value1, [value2, ...])
You can select cells one by one, but also ranges, or even multiple ranges.
The STDEV.P function ignores cells that do not contain numbers.
Note: Standard deviation (σ) measures how far a 'typical' observation is from the average of the data (μ). You can read more about standard deviation in the Statistics - Standard Deviation Chapter.
Tip: There is another function called =STDEV.S that can be used if you have the data for a sample.
Let's have a look at an example!
Stdev.p Function Example
Find the standard deviation of the total stats for all of the Pokemon in the population:
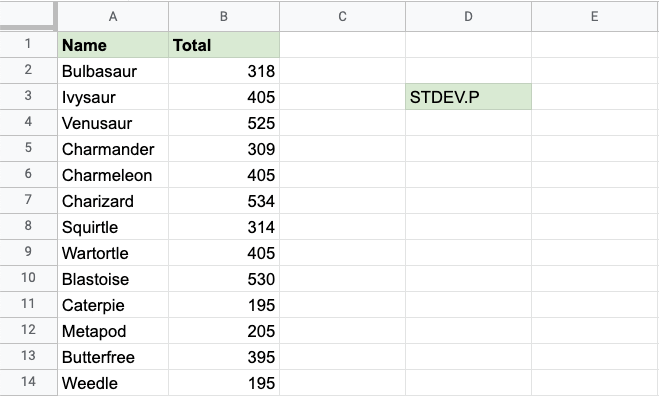
Note: The full dataset continues after row 14, all the way down to row 759.
The STDEV.P function, step by step:
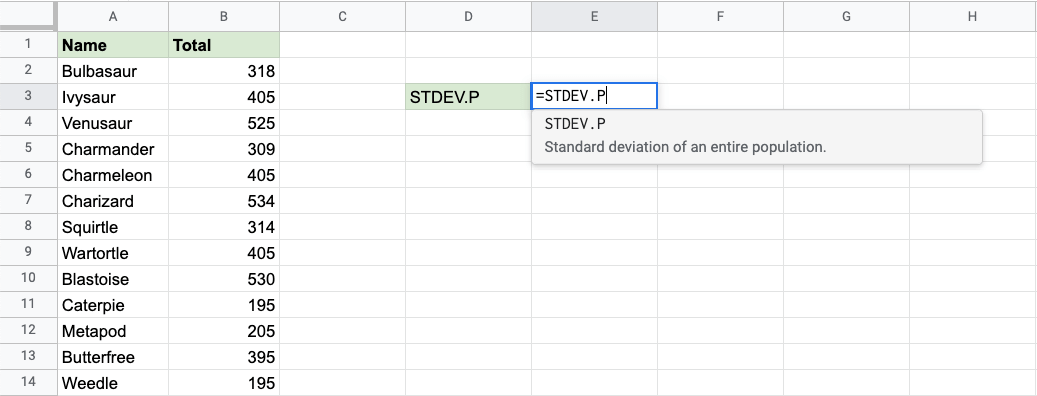
- Select the cell
E3 - Type
=STDEV.P - Click the STDEV.P command
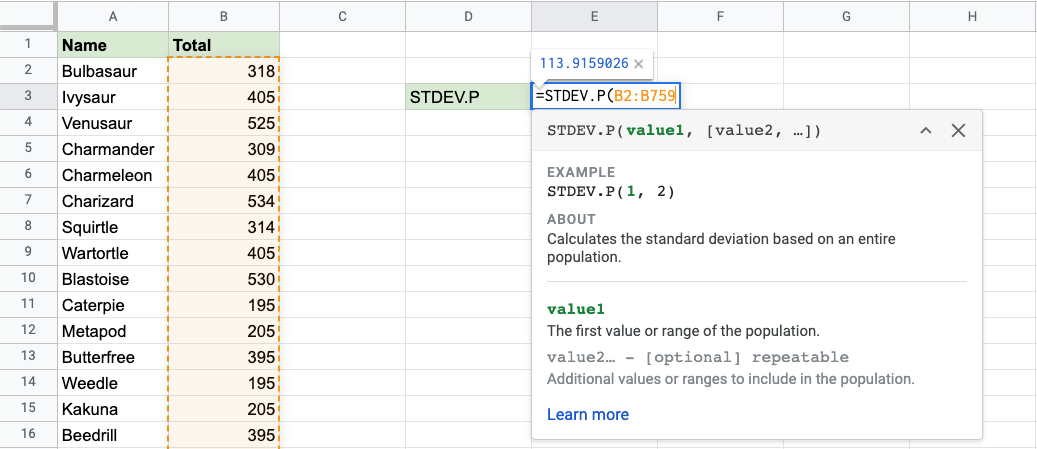
- Specify the range
B2:B759for the Total stats for all the Pokemon - Hit enter
Now, the function returns the standard deviation of all the Total stat values:
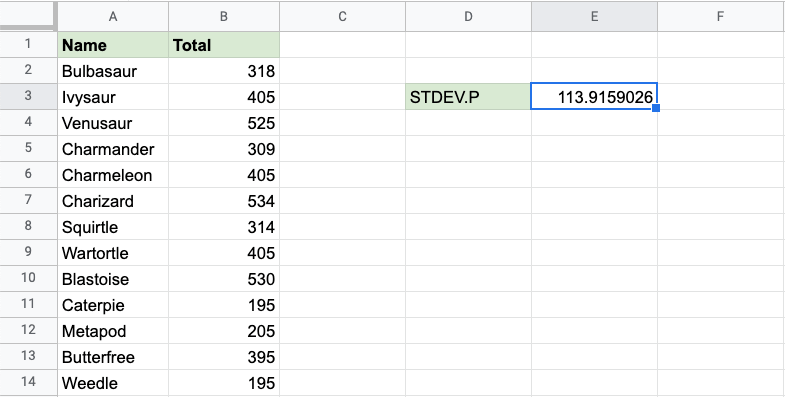
The STDEV.P function has successfully returned the Standard Deviation for the whole population as 113,9159026.

